Software Multiple Compression
I was listening to a recent epsisode of Bg2 with venture capitalists Brad Gerstner and Bill Gurley. In this clip, Gerstner describes the current state of the market for public software companies, and I thought his description perfectly captures what is going on right now in tech.
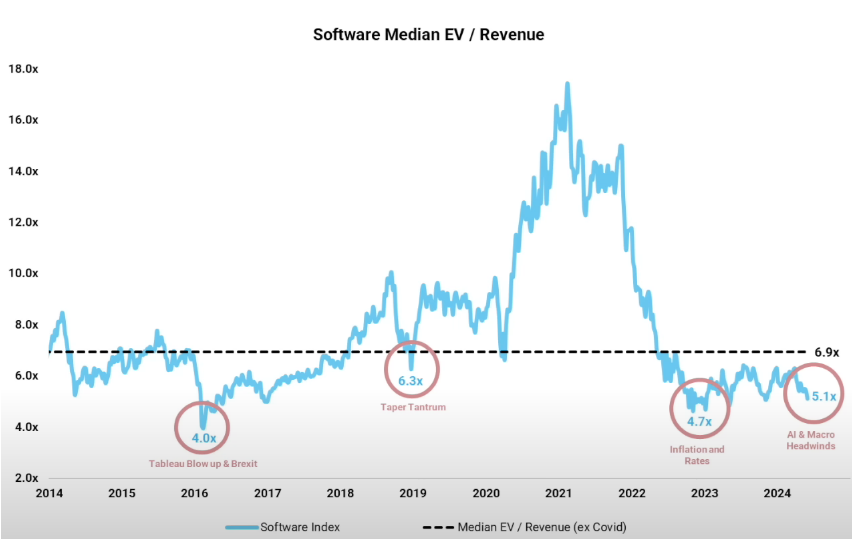
Essentially, software companies are facing three main headwinds:
- Increase in uncertainty
- Decrease in growth
- Increase in interest rates
These three forces are compressing software multiples and by extension, software valuations. This multiple compression increases pressure on profitability, raises scrutiny over headcount, and promotes belt-tightening within software companies as we have been seeing for the past two years.
Multiples are currently far below historical averages—software is cheap.
I wanted to explore this dataset for myself, so I decided to put together some Python code to look into the current state of the market for public software companies. I put all the code into a Jupyter Notebook, which is available on my Github and on Google Colab if you want to follow along. You can also re-run this same analysis for any list of tickers if you want to do comparisons with other public companies.
Yahoo Finance and Thread Pools
To start, I grabbed the list of tickers included in the Altimeter Capital graphic with an image to text tool, then I parsed these and added them to a list. I wrote a quick function to pull the financials (market cap, debt, cash, revenue, and free cash flow) for a given ticker from Yahoo Finance using the yfinance module, filtering out any tickers with missing data.
def compute_multiples(self, ticker):
    stock = yf.Ticker(ticker)

    try:
        market_cap = stock.info['marketCap']
        debt = stock.info.get('totalDebt', 0)
        cash = stock.info.get('totalCash', 0)
        ev = self.compute_ev(market_cap, debt, cash)
        revenue = stock.financials.loc['Total Revenue'][0]
        fcf = stock.cashflow.loc['Free Cash Flow'][0]
        ev_revenue = ev / revenue if revenue else None
        ev_fcf = ev / fcf if fcf else None
        if ev_revenue is not None and not np.isnan(ev_revenue):
            self.ev_revenue[ticker] = ev_revenue
        if ev_fcf is not None and not np.isnan(ev_fcf):
            self.ev_fcf[ticker] = ev_fcf

    except KeyError as e:
        print(f"Data not available for {ticker}: {e}")
        self.skips += 1
Yahoo Finance is great for free, public financial data, however it is mostly limited to current data. For example, it does not have historical market cap data. Because of this I limited my analysis to just a snapshot of the present.
Next, I setup a thread pool so we can call Yahoo Finance async from multiple threads. This will speed up the data retrieval so we can quickly pull data for different collections of tickers. I added some logic for chunking the tickers into groups to distribute the load evenly across threads. For more details on multithreading in Python see my previous blog post here.
def chunk_tickers(self):
    chunk_size = len(self.tickers) // self.threads
    remainder = len(self.tickers) % self.threads
    chunks = [self.tickers[i:i + chunk_size] for i in range(0, len(self.tickers)-remainder, chunk_size)]

    for i in range(remainder):
        chunks[i % self.threads].append(self.tickers[-(i+1)])

    print("Chunking Tickers into {} chunks with average size {}".format(len(chunks), chunk_size))
    return chunks

def process_tickers(self):
    chunks = self.chunk_tickers()

    for chunk in chunks:
        for ticker in chunk:
            self.pool.submit(self.compute_multiples, ticker)

    self.pool.shutdown(wait=True)
    print("Skipped {} tickers. Processed {} total.".format(self.skips, len(self.tickers) - self.skips))
    self.sort_data()
Finally, I added some code to aggregate stats, plot the data, and export to a CSV.
Results and Analysis
After retrieving and filtering the data, we are left with 77 tickers, down from the original 105 from Altimeter Capital. Here are the results for our aggregate statistics:
| EV/Revenue | EV/FCF | |
|---|---|---|
| Mean | 7.42 | 30.99 |
| Median | 5.95 | 29.11 |
| Standard Deviation | 5.52 | 139.97 |
Our results for median EV / Revenue come out to 5.9, compared to 5.1 for the results from Altimeter. These differences are likely due to the tickers we exluded, plus changes in the data over the last couple of weeks.
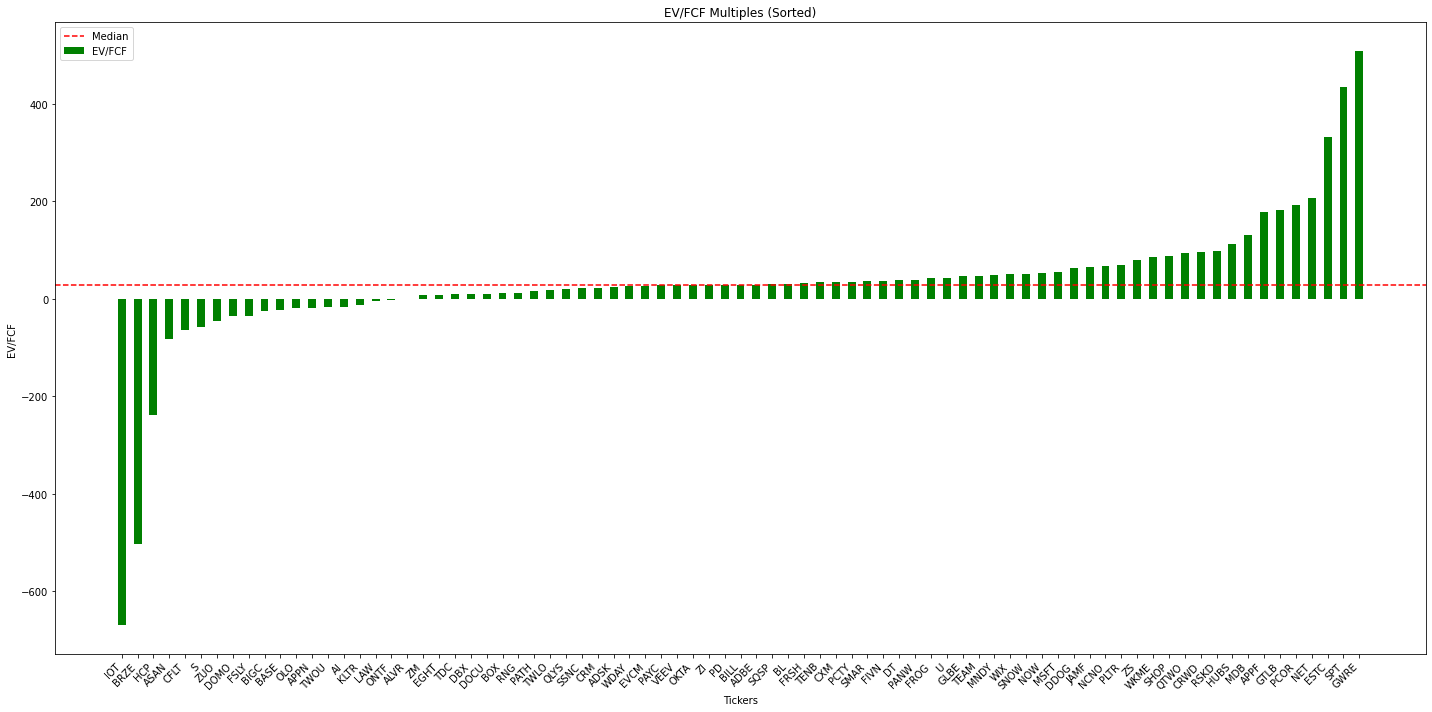
Similarly, our results for median EV / FCF came out to 29.1 compared to 31.8 from the analysis by Goldman Sachs included in episode 10 of Bg2. Again, I think these differences are due to recent changes in the data, and likely a different set of tickers.
Since we have data for all the individual tickers, we can go a bit deeper than a "Software Index" calculation. We can take a look at the distribution of these multiples. Below I included the graphs and a dump of some of the data. The graphs are a bit hard to read and are more clear on Google Colab here. Regardless, this data gives an idea of the current landscape of the market for software companies. Many of these companies are trading at multiples far below the current and long term median values. If you are long software then, in the words of Brad Gerstner, it's time to go hunting!
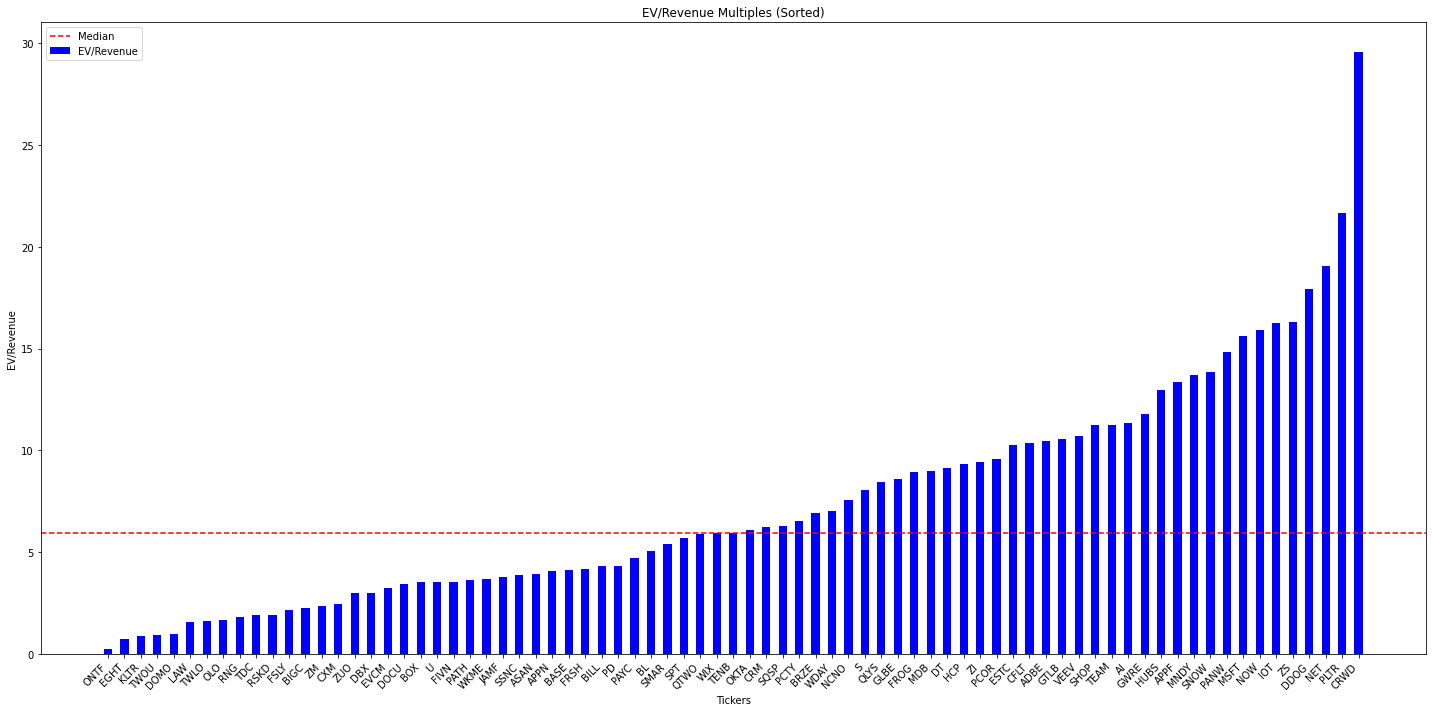
Companies Trading Below Median EV / Revenue
| Ticker | EV/Revenue |
|---|---|
| ONTF | 0.25 |
| EGHT | 0.76 |
| KLTR | 0.9 |
| TWOU | 0.95 |
| DOMO | 1.02 |
| LAW | 1.6 |
| TWLO | 1.65 |
| OLO | 1.7 |
| RNG | 1.84 |
| TDC | 1.93 |
| RSKD | 1.94 |
| FSLY | 2.15 |
| BIGC | 2.26 |
| ZM | 2.34 |
| CXM | 2.45 |
| ZUO | 3.02 |
| DBX | 3.02 |
| EVCM | 3.26 |
| DOCU | 3.45 |
| BOX | 3.54 |
| U | 3.54 |
| FIVN | 3.55 |
| PATH | 3.63 |
| WKME | 3.71 |
| JAMF | 3.8 |
| SSNC | 3.9 |
| ASAN | 3.95 |
| APPN | 4.08 |
| BASE | 4.12 |
| FRSH | 4.19 |
| BILL | 4.31 |
| PD | 4.35 |
| PAYC | 4.72 |
| BL | 5.04 |
| SMAR | 5.4 |
| SPT | 5.7 |
| QTWO | 5.92 |
| WIX | 5.95 |
Companies Trading Below Median EV / FCF
| Ticker | EV/Revenue |
|---|---|
| ONTF | 0.25 |
| EGHT | 0.76 |
| KLTR | 0.9 |
| TWOU | 0.95 |
| DOMO | 1.02 |
| LAW | 1.6 |
| TWLO | 1.65 |
| OLO | 1.7 |
| RNG | 1.84 |
| TDC | 1.93 |
| RSKD | 1.94 |
| FSLY | 2.15 |
| BIGC | 2.26 |
| ZM | 2.34 |
| CXM | 2.45 |
| ZUO | 3.02 |
| DBX | 3.02 |
| EVCM | 3.26 |
| DOCU | 3.45 |
| BOX | 3.54 |
| U | 3.54 |
| FIVN | 3.55 |
| PATH | 3.63 |
| WKME | 3.71 |
| JAMF | 3.8 |
| SSNC | 3.9 |
| ASAN | 3.95 |
| APPN | 4.08 |
| BASE | 4.12 |
| FRSH | 4.19 |
| BILL | 4.31 |
| PD | 4.35 |
| PAYC | 4.72 |
| BL | 5.04 |
| SMAR | 5.4 |
| SPT | 5.7 |
| QTWO | 5.92 |
| WIX | 5.95 |