Running the Numbers: Data on my First Marathon
I recently completed the Marine Corps Marathon in DC! This was my first marathon and I wanted to share some of the data I collected along the way, both in training and from the actual race.
Results
I finished in 4:15:33, with an average pace of 9:45 minutes per mile. This was a bit slower than my original goal of 4:00, but overall I'm happy with the results. Here's how I performed relative to the rest of the group (full results here):| Category | Rank | Total | Percentile |
|---|---|---|---|
| Overall | 6,050 | 16,168 | 62.58 |
| M Gender | 4,347 | 10,129 | 57.08 |
| M 20 to 24 | 600 | 1,067 | 43.77 |
My pace was solid for the first half marathon, but I started to hit a wall. I think I came off a little too strong and ran out of gas towards the end. I maintained a roughly 8.5 minute pace for the first half, and ended with over an 11 minute pace.
Running the Numbers
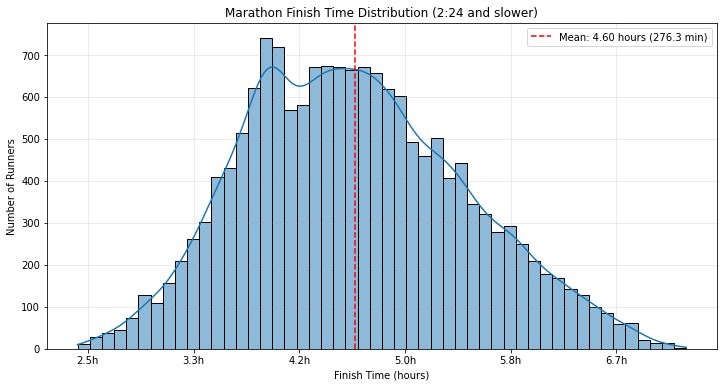
I wanted to see how my own results compared to all the other runners. I was particularly interested in the shape of the distribution of finishing times and the graph of pace over distance for different finishing times. I pulled all the data from the MCM website (more details on how I did this below) and here's what I found:
Distribution of Finishing Times

The finishing times were a bit more normally distributed than I expected. There was a cluster of finishers between 3:45 and 4:15, but other than that the distribution was pretty evenly spread out.
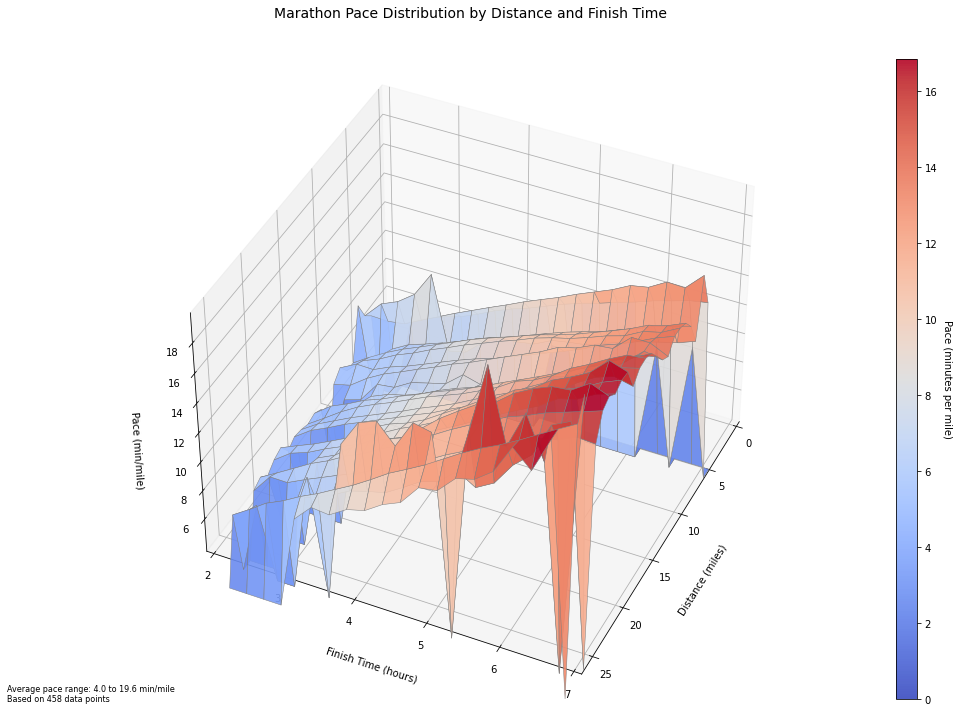
Race Splits for Different Pace Zones
In the chart below, I grabbed a random candidate from each of the 30 minute finishing time buckets from under 2:30 to under 7:30. I plotted the pace over distance for each candidate to see how pace changed throughout the race for runners with different speed profiles.

Unsuprisingly, the fastest runners had a very consistent pace, while the slower runners had much more variance in their pace profiles over the course of the race. The better performing runners also tended to speed up a bit after mile 20, while the slower runners tended to consistently slow down after mile 10.
Training
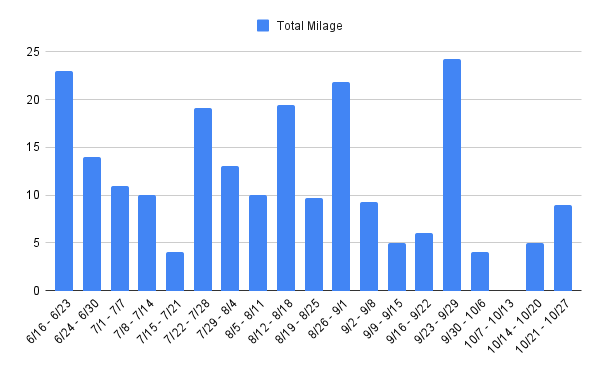
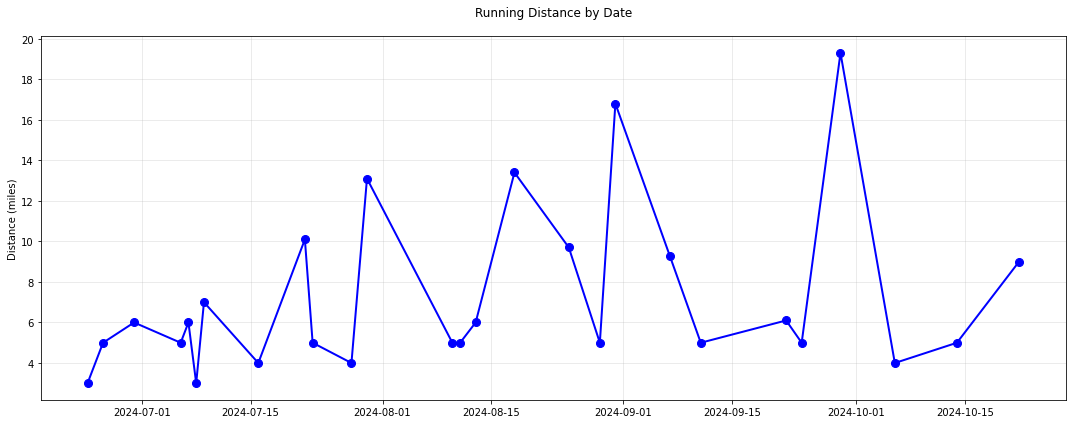
I started tracking my mileage 18 weeks out from the race. I did not follow a strict training schedule, but focused on incremental and consistent mileage. My strategy was to maintain 10-20 miles a week. I would typically do a long run on Saturday or Sunday, and one or two shorter to medium distance runs during the week. I gradually increased my long run from 10 miles to a maximum of 19. In terms of intensity I mixed in some shorter faster paced runs along with my slower paced long runs. I was able to stay pretty consistent with this schedule, exluding a couple of weeks in early October where I was sick and had a nagging injury.


Next Time
Ultimately, I really enjoyed my first marathon, and I plan on doing another one. I've taken a break from running the last few weeks, but am planning to get back into it soon. For next time, I think I would adjust my training schedule to get some more consistent mileage. I think having some more milage under my feet would have helped me hold on to a stronger pace in the second half of the race. Whenever I do decide to do my next marathon, I'll be sure to collect more data as I go.
Gathering the Data
I always really enjoy figuring out how to extract data like this into a useful format. In this case I was able to just use the public API used by the MCM website.
Extracting the Data
I went to the MCM results website, opened my web browser dev tools to the networking tab, and I started to look at the outgoing requests as I poked around in the UI. I quickly found two relevant API endpoints that were being hit on the frontend:- https://api.rtrt.me/events/MCM-2024/profiles
- https://api.rtrt.me/events/MCM-2024/profiles/{pid}/splits
appid and token. I just used the values being supplied by my browser, and I was able to hit the endpoints without any issues. The /profiles endpoint accepted a search field, which consistently returned a single result for a given bib number. I used this endpoint to get the pid for a runner from the bib number, and then used the pid to retrieve the additional data, including the splits and finishing times. I knew there were only roughly 16,000 runners, but I was able to get results for bib numbers as high as 25,100, so to be safe I decided on the range of 0 to 30,000.
Processing Fast with Threads
Once I got all the code good to go to extract and parse the data for a single bib number, I setup a thread pool so that I could collect all the data async pretty quickly. I experimented with a few different thread counts to get a feel for the throughput, error rates, and any potential rate limiting. I started off with a chunk of 100 bibs:
| Threads | Time (s) | Bibs/s | Success % | Errors |
|---|---|---|---|---|
| 10 | 9.33 | 10.83 | 76.2% | 24 |
| 20 | 5.44 | 18.57 | 76.2% | 24 |
| 100 | 1.39 | 72.42 | 76.2% | 24 |
I then increased to a chunk of 1000.
| Threads | Time (s) | Bibs/s | Success % | Errors |
|---|---|---|---|---|
| 100 | 15.96 | 62.74 | 79.4% | 206 |
| 500 | 12.47 | 80.25 | 79.4% | 206 |
| 1000 | 10.83 | 92.41 | 79.4% | 206 |
I found that the number of errors was consistent across the thread counts, so I thought it was safe to assume I wasn't being rate limited. I also found that the marginal improvement on throughput on my local machine started to drop off after ~100 threads. I ended up going with 500 threads for the full extraction.
| Metric | Value |
|---|---|
| Thread count | 500 |
| Total time | 351.39 seconds |
| Average chunk time | 291.29 seconds |
| Chunk time std dev | 60.81 seconds |
| Total bibs processed | 30,001 |
| Successful | 16,625 |
| Failed | 13,376 |
| Processing rate | 85.38 bibs/second |
Within 6 minutes, I was able to extract all the data to a ~50mb json file on my local machine.