Building with the FRED API and US Treasury Data
Introduction
Earlier this year when I first started work, I was faced with a lot of financial decisions about budgeting, student loans, saving, investing, and retirement. While researching and navigating these decisions, I found myself looking for a "dashboard" of the US economy, or a single page snapshot of all the key economic metrics.
I couldn't really find what I was looking for on the internet, so I decided to build it myself using Next.js, the FRED API, and data from the US Department of the Treasury.
The goal of this project is to aggregate the most important economic data into a single page to tell the story of what is happening in the economy.
The dashboard is now live here hosted on Vercel.
In this blog post I'm going to walk through how I built this and some ideas for future improvements.
FRED API
The gold standard for economic data is FRED, from the Federal Reserve Bank of St. Louis. FRED has a ton of economic datasets, and a solid API, so I decided to use FRED as my main source of economic data.
I included the following datasets:
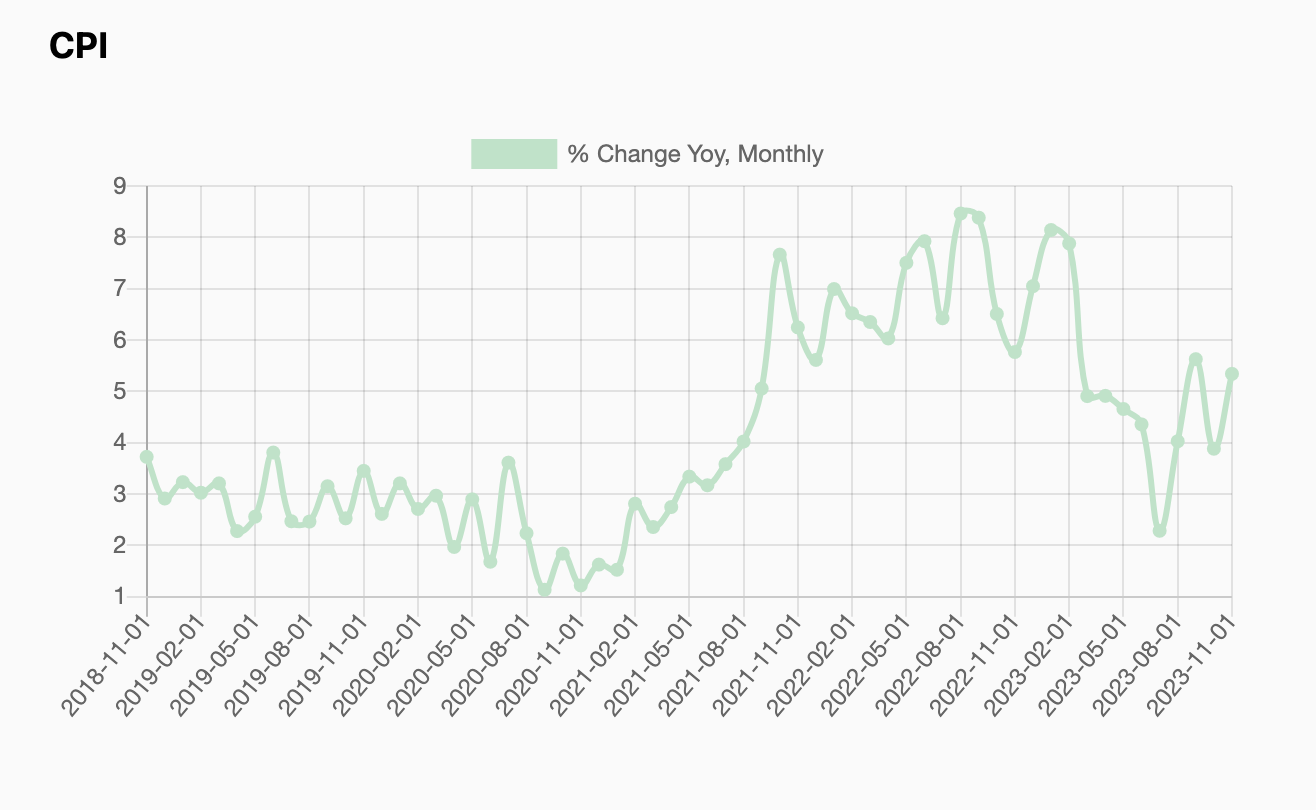
- CPI
- Federal Funds Rate
- S&P 500
- 30 Year Mortgage Rate
- Real GDP Growth
- M2 Money Supply Growth
- Unemployment Rate
- Treasury Yield Curve
To me, these eight datasets are the most important for telling the story of what is happening in the US economy. The FRED API and the frontend components I built are both very flexible so I can update this list or add more as I see fit. I wanted to limit the number of datasets I included so that the dashboard is not too busy.
To actually grab this data from the FRED API, you will need to create your own API key. From there, you can make a simple curl call or a get request to the endpoint of interest, and set any parameters mentioned in the API docs.
For example, I can hit the following URL to grab all CPI data in json format (add your own API Key):
https://api.stlouisfed.org/fred/series/observations?series_id=MEDCPIM158SFRBCLE&api_key={YOUR_API_KEY_HERE}&file_type=json'In my Next.js site, I created API Routes for each of the datasets to call the FRED API and return the data. On the frontend, I created some components to parse out the data based on the frequency (daily, monthly, etc), and graph it using chart.js.
US Treasury Data

The one dataset that was not easily available on FRED was the US Treasury yield curve. This is partly because the yield curve is a bit different than all the other datasets. The yield curve is a snapshot of the different treasury yields at a moment in time. FRED only has timeseries datasets for the individual treasuries.
I considered constructing this dataset by aggregating data from several different FRED APIs, but I decided it would be easier to go straight from the source and use the US Department of the Treasury website.
The US Treasury offers the daily yield curve rates on their website, and in raw XML through this URL:
'https://home.treasury.gov/resource-center/data-chart-center/interest-rates/pages/xmlview?data=daily_treasury_yield_curve&field_tdr_date_value_month=202312'The field_tdr_date_value_month parameters sets the year and month for the data. The XML returned contains the yield curve snapshot for every day in the given month, up to the current day if in the current month. This means we can just pass in the current year and month into that URL, parse the XML response, and graph the data using our same frontend graph component from earlier.
I decided to only include the most recent available yield curve snapshot, rather than provide any historical data for the sake of keeping things simple.
Improvements
While the purpose of this project was to provide a very simple dashboard, there are a few improvements I have in mind that I may implement in the future.
First, I want to add the functionality to toggle the time period for the FRED data. Right now all the FRED datasets are set to five years. I think it could be useful for a user to be able to toggle this to one year or ten years, similar to what you can do on FRED.
For the treasury yield curve, I might add the historical data. Since this data is not available on FRED directly, there might be value in providing it for users to view or download. Another idea is including the FRED time series data for all the individual treasuries, and moving all the treasury data to a separate page, possibly with some unique visualizations of the yield curve data overtime. The yield curve is really just a slice of the three dimensional "yield space" at a moment in time. It could be a cool visualization to provide the entire yield space with the option to click and view the yield curve "slice" at any given moment in time historically. Another idea is to do lookups against similar yield curves.
Finally, one of the downsides of using the US Treasury website is the latency: nearly ten seconds to get the data for a single month. I would ideally like to reduce this latency.
sep = 'https://home.treasury.gov/resource-center/data-chart-center/interest-rates/pages/xmlview?data=daily_treasury_yield_curve&field_tdr_date_value_month=202309'
%timeit response = requests.get(sep)
9.59 s ± 830 ms per loop (mean ± std. dev. of 7 runs, 1 loop each)
For the website itself, I am considering cleaning it up a bit, doing some SEO stuff, and getting a domain name.
The last thing is the name. I'm really not a fan of "Fin Dash", but it was all I could come up so far. Please reach out if you have any ideas for a better name, or any other feedback!