Dice Sum Probability from Catan to Craps
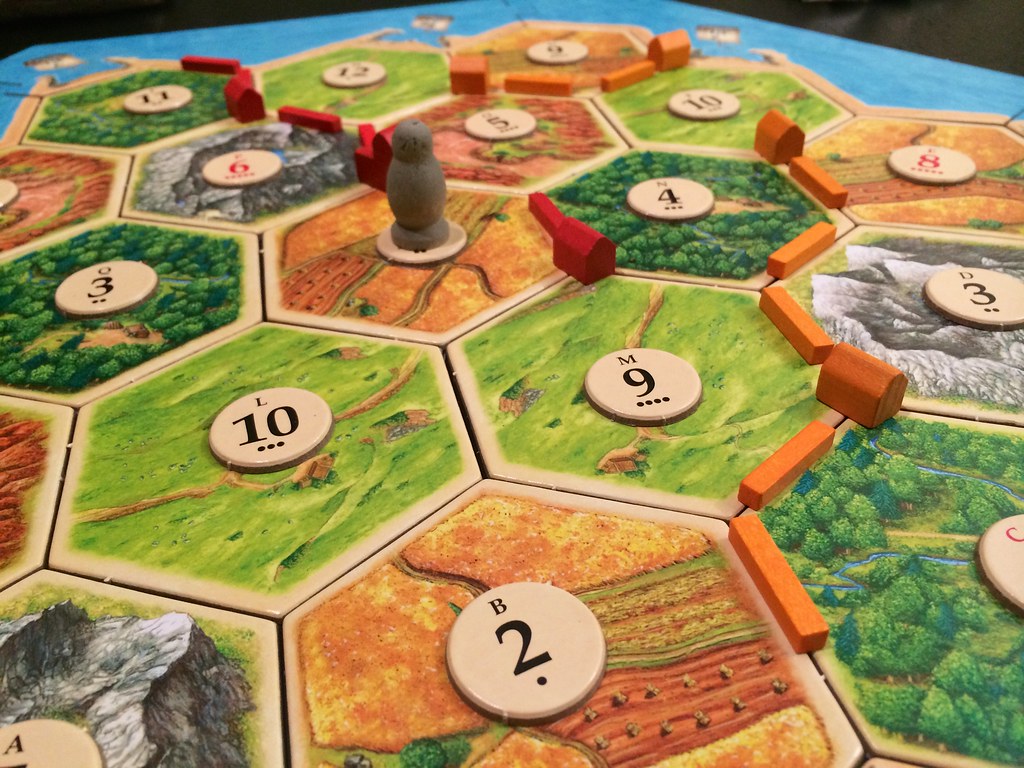
Like many strategy games, Settlers of Catan is driven by probability. Players start each turn by rolling two six-sided dice. The sum of the dice determines which tiles on the board are chosen to yield resources. Players with settlements on the vertices of a selected tile will then earn resources, and can use them to trade, build, settle, and earn victory points. Resources determine the flow of the game. If a player rolls a seven however, anyone with more than 7 items must discard half their resources.
Similarly in the casino game Craps, the shooter rolls a pair of dice, and players place bets that depend on the sum of the dice. There are many types of bets that can be placed in Craps. One of which is betting on the pass line–this means a player will win if the sum of the roll is a 7 or 11, and they will lose if the sum is a 2, 3, or 12. Any other sum becomes "the point," and the shooter must roll the point again before rolling a 7 for the bettor to profit. Just as the robber in Catan forces players to lose resources, rolling a 7 in craps ends the round and causes players to forfeit any bets placed on the point.

In this blog post we’re going to explore the probability behind Catan and Craps. We’ll write some python code to model the sum of two dice. Then we'll expand on this and consider what happens to the probability distribution when we tweak the number of dice, the number of sides on each die, and the operation we perform on the dice.
I recommend following along in a Jupyter Notebook. You can also work off of Google Colab. Here are the links:
Jupyter Notebook Files on Github
Google Colab
We’ll be using the following python modules:
import itertools
import numpy as np
from collections import defaultdict
import matplotlib.pyplot as plt
Modeling the Sum of Two Dice
Let’s start by modeling what actually happens when we roll in Catan or Craps.
def dice_sums(n, m):
    results = {}
    sum_counts = defaultdict(int)
    possible_rolls = defaultdict(list)
    total_combs = 0
    dice_roll = [i for i in range(1, m+1)]
    probabilities = {}

    for comb in itertools.product(*[[i for i in range(1, m+1)] for j in range(n)]):
        comb_sum = sum([num for num in comb])
        sum_counts[comb_sum] += 1
        possible_rolls[comb_sum].append(comb)
        total_combs += 1

    for key, value in sum_counts.items():
        probabilities[key] = round(value / total_combs * 100, 3)
        results[key] = (value, probabilities[key], possible_rolls[key])

    plt.scatter(*zip(*sum_counts.items()))
    plt.show()
    return (sum_counts, possible_rolls, probabilities, total_combs)
The dice_sums method computes the outcomes and probabilities for the sum of n m-sided dice using a Cartesian product. When we call dice_sums(2,6) this will compute the results for two six-sided dice. Let's look at the graph of the probabilities:
We can see clearly from the results that seven has the highest probability (16.67%), followed by six and eight (13.89% each). The probabilities decrease in pairs linearly as we move away from seven.
Increasing Number of Dice and Sides
What happens, though, as we scale up the number of dice and the number of sides on each die? Let's try running dice_sums with some different values.
def compare(sides):
    data_list = [dice_sums(n,m)[2] for n,m in sides]

    for i, data in enumerate(data_list):
        values = list(data.values())
        plt.plt(range(1, len(values)+1), values, linestyle='-', marker='o', label=f'{sides[i][0]} dice, {sides[i][1]} sides')

    plt.xlabel('Values')
    plt.ylabel('Probabilities')
    plt.legend()
    plt.show()

compare([(2, 6), (6,2), (6,6), (12,3), (3,12)])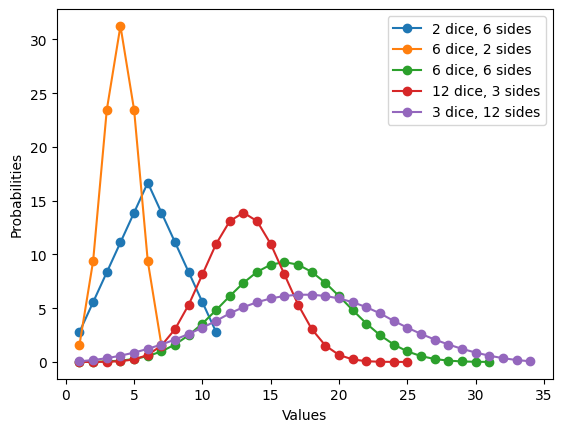
As we can see from the data, the probability distribution changes as we add more sides and dice. Generally, as we increase the number of dice, holding the number of sides constant, the distribution becomes tall with narrow tails. While if we increase the number of sides, holding the number of dice constant, the distribution becomes flatter with wider tails.
Exploring Other Operations
Now let's consider what happens when we change the operation we perform on the dice. To do this we'll need to tweak our code and write a method for generalized dice operations. For now we'll look at subtraction and multiplication. For subtraction, we'll assume n=2, or that there are two dice, and that we always subtract the smaller number from the larger.
def dice_ops(n, m, op):
    results = {}
    sum_counts = defaultdict(int)
    possible_rolls = defaultdict(list)
    total_combs = 0
    dice_roll = [i for i in range(1, m+1)]
    probabilities = {}

    for comb in itertools.product(*[[i for i in range(1, m+1)] for j in range(n)]):
        if op == 'add':
            comb_result = sum(comb)
        elif op == 'subtract':
            max_val = max(comb)
            min_val = min(comb)
            comb_result = max_val - min_val
        elif op == 'multiply':
            product = 1
            for num in comb:
                product *= num
            comb_result = product
        sum_counts[comb_result] += 1
        possible_rolls[comb_result].append(comb)
        total_combs += 1

for key, value in sum_counts.items():dice_ops(2, 6, 'subtract')
This distribution is interesting. The highest probability outcome is one (27.78%), regardless of how many sides the dice have. The probabilities then decrease linearly as we move up from one. The outcome of zero also has a relatively high probability (16.67%) compared to other results.
dice_ops(2, 6, 'multiply')
The distribution of the product of dice is more scattered. We can see several peaks at 6 and 12 (11.11% each), with most other products occurring with either 5.56% or 2.78% probability. As we increase the number of sides and dice, it converges on an exponential distribution.
Wrapping Up
Let's go back to where we started with the sum of two six-sided dice. This creates a simple probability distribution that provides the basis to make games like Catan and Craps exciting and enjoyable. While some of the other distributions we explored may not be as practical–I wouldn't enjoy a game where you roll ten dice every turn–understanding how to engineer different probability distributions from simple building blocks like dice rolls is a useful skill for designing gameplay, rules, and user experiences.
What kind of gameplay could you create with the distribution from subtracting two six-sided die? What about an exponetial distribution, where would a high probability of low values and a low probability of occasionally much higher values be interesting? What are some other ways you could acheive the same probability distributions without using dice rolls? The possibilities are endless, and you now have the tools to experiment and come up with new distributions to build new games and ideas.